
Evaluating Tone Preservation in ASR: How Meta's omniASR Handles Igbo Diacritics
This is a brief guide to my evaluation of tonal preservation in facebook’s omniASR-CTC-1B Automatic Speech Recognition (ASR) model for Igbo, a tonal Niger-Congo language with 45 million speakers. The model claims support for 1,600+ languages including Igbo, but what does “support” mean when tone changes word meaning? I created 21 designed audio samples, ran them through the model, and found that on the tonal samples 37 of 49 expected tone and dot-below marks (75.5%) were missing from the output. The pattern is consistent with the model leaning on orthographic priors rather than acoustic tone, although one speaker and 21 clips cannot establish that. I cannot simplify this investigation any further.
Where to find it: The dataset with audio is on HuggingFace. The code and analysis are on GitHub. The full analysis notebook is available at analysis.ipynb.
This post was corrected on 17 October 2026. Earlier versions mixed two different metrics (a 61.2% net loss and a 75.5% drop rate), described a bootstrap mean that was really the drop rate, described the overlap between the tonal interval and the other categories incorrectly (it overlaps two of the three others), and reported a similarity score as CER. All numbers below are recomputed from the dataset, with dropped and added marks counted per clip. The monotone-clip and minimal-pair claims are softened to what one speaker and 21 clips can support, and word meanings for the akwa forms were removed pending a check against a standard Igbo reference.
The following is my guide to stepping through the evaluation methodology.
The Problem
In Igbo, tone is phonemic. This means tone changes word meaning, not just prosody. The same consonants and vowels, written with different tone marks, give different words:
- akwa
- akwà
- àkwà
- ákwá
The tone marks (diacritics) are the only thing distinguishing them. When omniASR lists Igbo as “supported,” does it preserve these tonal distinctions? Or does “support” just mean “we trained on some Igbo data”?
Dataset Design
I recorded 21 audio samples using my iPhone SE Voice Memos app. Each sample targets a specific failure mode across four categories.
A note on counting before the categories. A “mark” is one letter carrying a grave, acute, macron or dot-below (so ọ, ị, ụ count, and a letter with both a dot and a tone counts once). Dropped marks D and added marks H are counted per clip and then summed, so additions in one clip never cancel drops in another. Everything below is a percentage of expected marks E unless stated.
The first category tests cross-lingual orthographic interference. My hypothesis was that the model applies incorrect orthographic conventions from other languages to Igbo text. I recorded five samples: personal names, formal greetings, numbers in Igbo, a well-known proverb, and a slow prosody test. The references have 18 marks, mostly dot-below letters. The model produced 25: 2 dropped and 9 added (net loss -38.9%, drop rate 11.1%, added rate 50.0%). Only 4 of the produced marks are tone marks, so part of the “addition” is orthographic convention rather than tone.
The second category tests phonemic tone sensitivity. The hypothesis here is that the model cannot distinguish phonemically contrastive tones. I recorded six samples including minimal pairs like akwa/akwà/àkwà/ákwá and oke/òkè/ọkè, dense tone marking, a monotone control, and two Yoruba controls. If the model used acoustic information I expected low loss. Instead 37 of 49 expected marks were dropped (drop rate 75.5%, net loss 61.2%, DER 89.8%), with a clip-level bootstrap 95% confidence interval on the drop rate of [57.1%, 89.7%].
The most suggestive clip is file 09. I spoke “O na-eri oji n’ututu” with deliberately flat intonation, with no tonal variation. The model transcribed it as “ọne rị ọjí nụ tútú”, which has 7 marks the reference does not: 3 acute tone marks and 4 dot-below letters. If the model were purely using acoustics, flat speech should not attract tone marks. It is one clip, and the dot-below additions may be standard orthography (my reference was written without dots), so I treat it as a lead, not proof.
The third category tests language boundary effects from code-switching. I hypothesized that switching between English and Igbo disrupts language-specific processing. Five samples test different patterns: English embedding into Igbo, Igbo embedding into English, sentence-level alternation, diacritics in English context, and Nigerian Pidgin as a control. Net loss was 14.3%, but that hides 7 of 14 expected marks dropped (drop rate 50.0%) and 5 added (added rate 35.7%). English portions were mostly transcribed, with errors, while adjacent Igbo lost marks.
The fourth category tests domain-specific lexical coverage. The hypothesis is that culturally specific terms outside the training distribution would struggle. I recorded Nigerian place names, Igbo food terms, long proverbs, French as a high-resource control, and background noise robustness. Net loss was the lowest at 6.3%, but 5 of 16 expected marks were dropped (31.2%) and 4 added (25.0%), and mean CER was 37.4%, indicating word-level errors.
The data looks like this (metadata.csv):
file_name,ground_truth,model_output,category,subcategory,language,character_error_rate,diacritics_expected,diacritics_produced,diacritic_loss
audio/06_tonal_akwa.wav,"Akwa, akwa, akwa. Akwà, akwà, akwà...","akua akua akua akua akwa akwa...",tonal_diacritics,minimal_pair,ibo_Latn,0.6,15,3,12
audio/09_tonal_flat.wav,"O na-eri oji n'ututu.","ọne rị ọjí nụ tútú",tonal_diacritics,monotone,ibo_Latn,0.744,0,7,-7
...
(The character_error_rate column in the released CSV is 1 - difflib ratio, a similarity-based score, not Levenshtein CER. The CER values quoted below are recomputed as true CER.)
Model Inference
I used omniASR’s official inference pipeline:
from omnilingual_asr.models.inference.pipeline import ASRInferencePipeline

pipeline = ASRInferencePipeline(model_card="omniASR_CTC_1B")
transcription = pipeline.transcribe(
    inp=["data/audio/06_tonal_akwa.m4a"],
    lang=["ibo_Latn"]
)
The model has 975 million parameters and uses a CTC-based ASR architecture with a wav2vec2-style encoder and CTC head. It was trained on multilingual data covering over 1,600 languages and released on November 14, 2025.
For each audio file, I extracted:
ground_truth = "akwa, akwa, akwa. Akwà, akwà, akwà. Àkwà, àkwà, àkwà. Ákwá, ákwá, ákwá."
model_output = transcription[0]['transcription']
# Compare and compute metrics
Metrics
Standard Character Error Rate (CER) conflates spacing errors with tonal errors. I defined metrics that isolate marks:
import unicodedata

COUNTED = {0x300, 0x301, 0x304, 0x323}   # grave, acute, macron, dot-below

def count_diacritics(text):
    # one count per letter (NFD cluster) that carries a counted mark
    out = []
    for ch in unicodedata.normalize("NFD", text):
        if unicodedata.combining(ch) and out:
            out[-1] += ch
        else:
            out.append(ch)
    return sum(1 for c in out if {ord(x) for x in c[1:]} & COUNTED)

def clip_counts(ground_truth, model_output):
    E = count_diacritics(ground_truth)   # expected
    P = count_diacritics(model_output)   # produced
    return E, P, max(0, E - P), max(0, P - E)   # E, P, dropped D, added H
Dropped D and added H are computed per clip and then summed over a category, so additions in one clip never cancel drops in another.
| Metric | Formula | What it captures |
|---|---|---|
| CER | Levenshtein distance / length | All character errors |
| Net loss | (E - P) / E | Net change in mark count (can be negative) |
| RDD (Drop rate) | D / E | Only missing marks |
| Added rate | H / E | Marks produced beyond expectation |
| DER | (D + H) / E | Total deviation from the reference |
Note that DER can exceed 100% when additions are substantial, because the denominator reflects ground truth expectations, not produced output. Counts also cannot tell a correct mark from a mark on the wrong letter; I add an alignment-based estimate for that below.
Bootstrap Uncertainty
With N=21 samples, I needed to quantify uncertainty. I used bootstrap resampling:
def bootstrap_ci(data, stat_fn, n_boot=10000, ci=0.95, seed=42):
    rng = np.random.default_rng(seed)
    n = len(data)

    # Point estimate
    point = float(stat_fn(data))

    # Bootstrap resampling of clips
    boots = np.empty(n_boot)
    for i in range(n_boot):
        idx = rng.integers(0, n, size=n)
        boots[i] = float(stat_fn(data.iloc[idx]))

    # Percentile CI (resamples where the rate is undefined are dropped and counted)
    ok = boots[~np.isnan(boots)]
    alpha = (1 - ci) / 2
    return point, float(np.quantile(ok, alpha)), float(np.quantile(ok, 1 - alpha))
Bootstrap resampling is at the clip level, not the mark level. Clips are the independent unit; resampling individual marks would treat the marks within one clip as independent and give intervals that are far too narrow. More resamples do not add information; only more independent clips (and speakers) do.
The headline is the point estimate on the original data, with the interval around it. For the tonal category that is 37/49 = 75.5%, with a bootstrap interval of [57.1%, 89.7%].
An earlier version of this post reported 61.2% as a “raw count” and 75.5% as a “bootstrap mean” and explained the gap by resampling giving more weight to extreme clips. That explanation was wrong: 61.2% is the net loss ((49 - 19) / 49, 37 dropped minus 7 added), and 75.5% is the drop rate (37/49). They are different metrics, and the interval was always an interval for the drop rate.
With only 21 samples, we need uncertainty quantification. Resampling clips 10,000 times shows:
Tonal lower bound: 57.1% drop rate
Non-tonal categories: intervals reach 0%
Not proof of a difference between all categories
Results
Quantitative Summary
| Category | Clips | E | Dropped | Added | Net loss | Drop rate | Added rate | DER | Mean CER |
|---|---|---|---|---|---|---|---|---|---|
| Phonemic Tone Sensitivity | 6 | 49 | 37 | 7 | 61.2% | 75.5% | 14.3% | 89.8% | 51.6% |
| Cross-lingual Interference | 5 | 18 | 2 | 9 | -38.9% | 11.1% | 50.0% | 61.1% | 28.5% |
| Language Boundary Effects | 5 | 14 | 7 | 5 | 14.3% | 50.0% | 35.7% | 85.7% | 25.7% |
| Domain-Specific Coverage | 5 | 16 | 5 | 4 | 6.3% | 31.2% | 25.0% | 56.2% | 37.4% |
| Overall | 21 | 97 | 51 | 25 | 26.8% | 52.6% | 25.8% | 78.4% | 36.5% |
Bootstrap Confidence Intervals (drop rate)
Tonal:             75.5%  (95% CI: [57.1%, 89.7%])
Overall:           52.6%  (95% CI: [30.3%, 69.7%])
Language boundary: 50.0%  (95% CI: [0%, 91.7%])
Domain:            31.2%  (95% CI: [0%, 83.3%])
Cross-lingual:     11.1%  (95% CI: [0%, 27.3%])
With 5 or 6 clips per category the non-tonal intervals are very wide. Counting only tone marks (grave, acute, macron), the references have 45 tone-bearing letters and the model output has 9; in the tonal clips it is 43 versus 5.
Visualizations
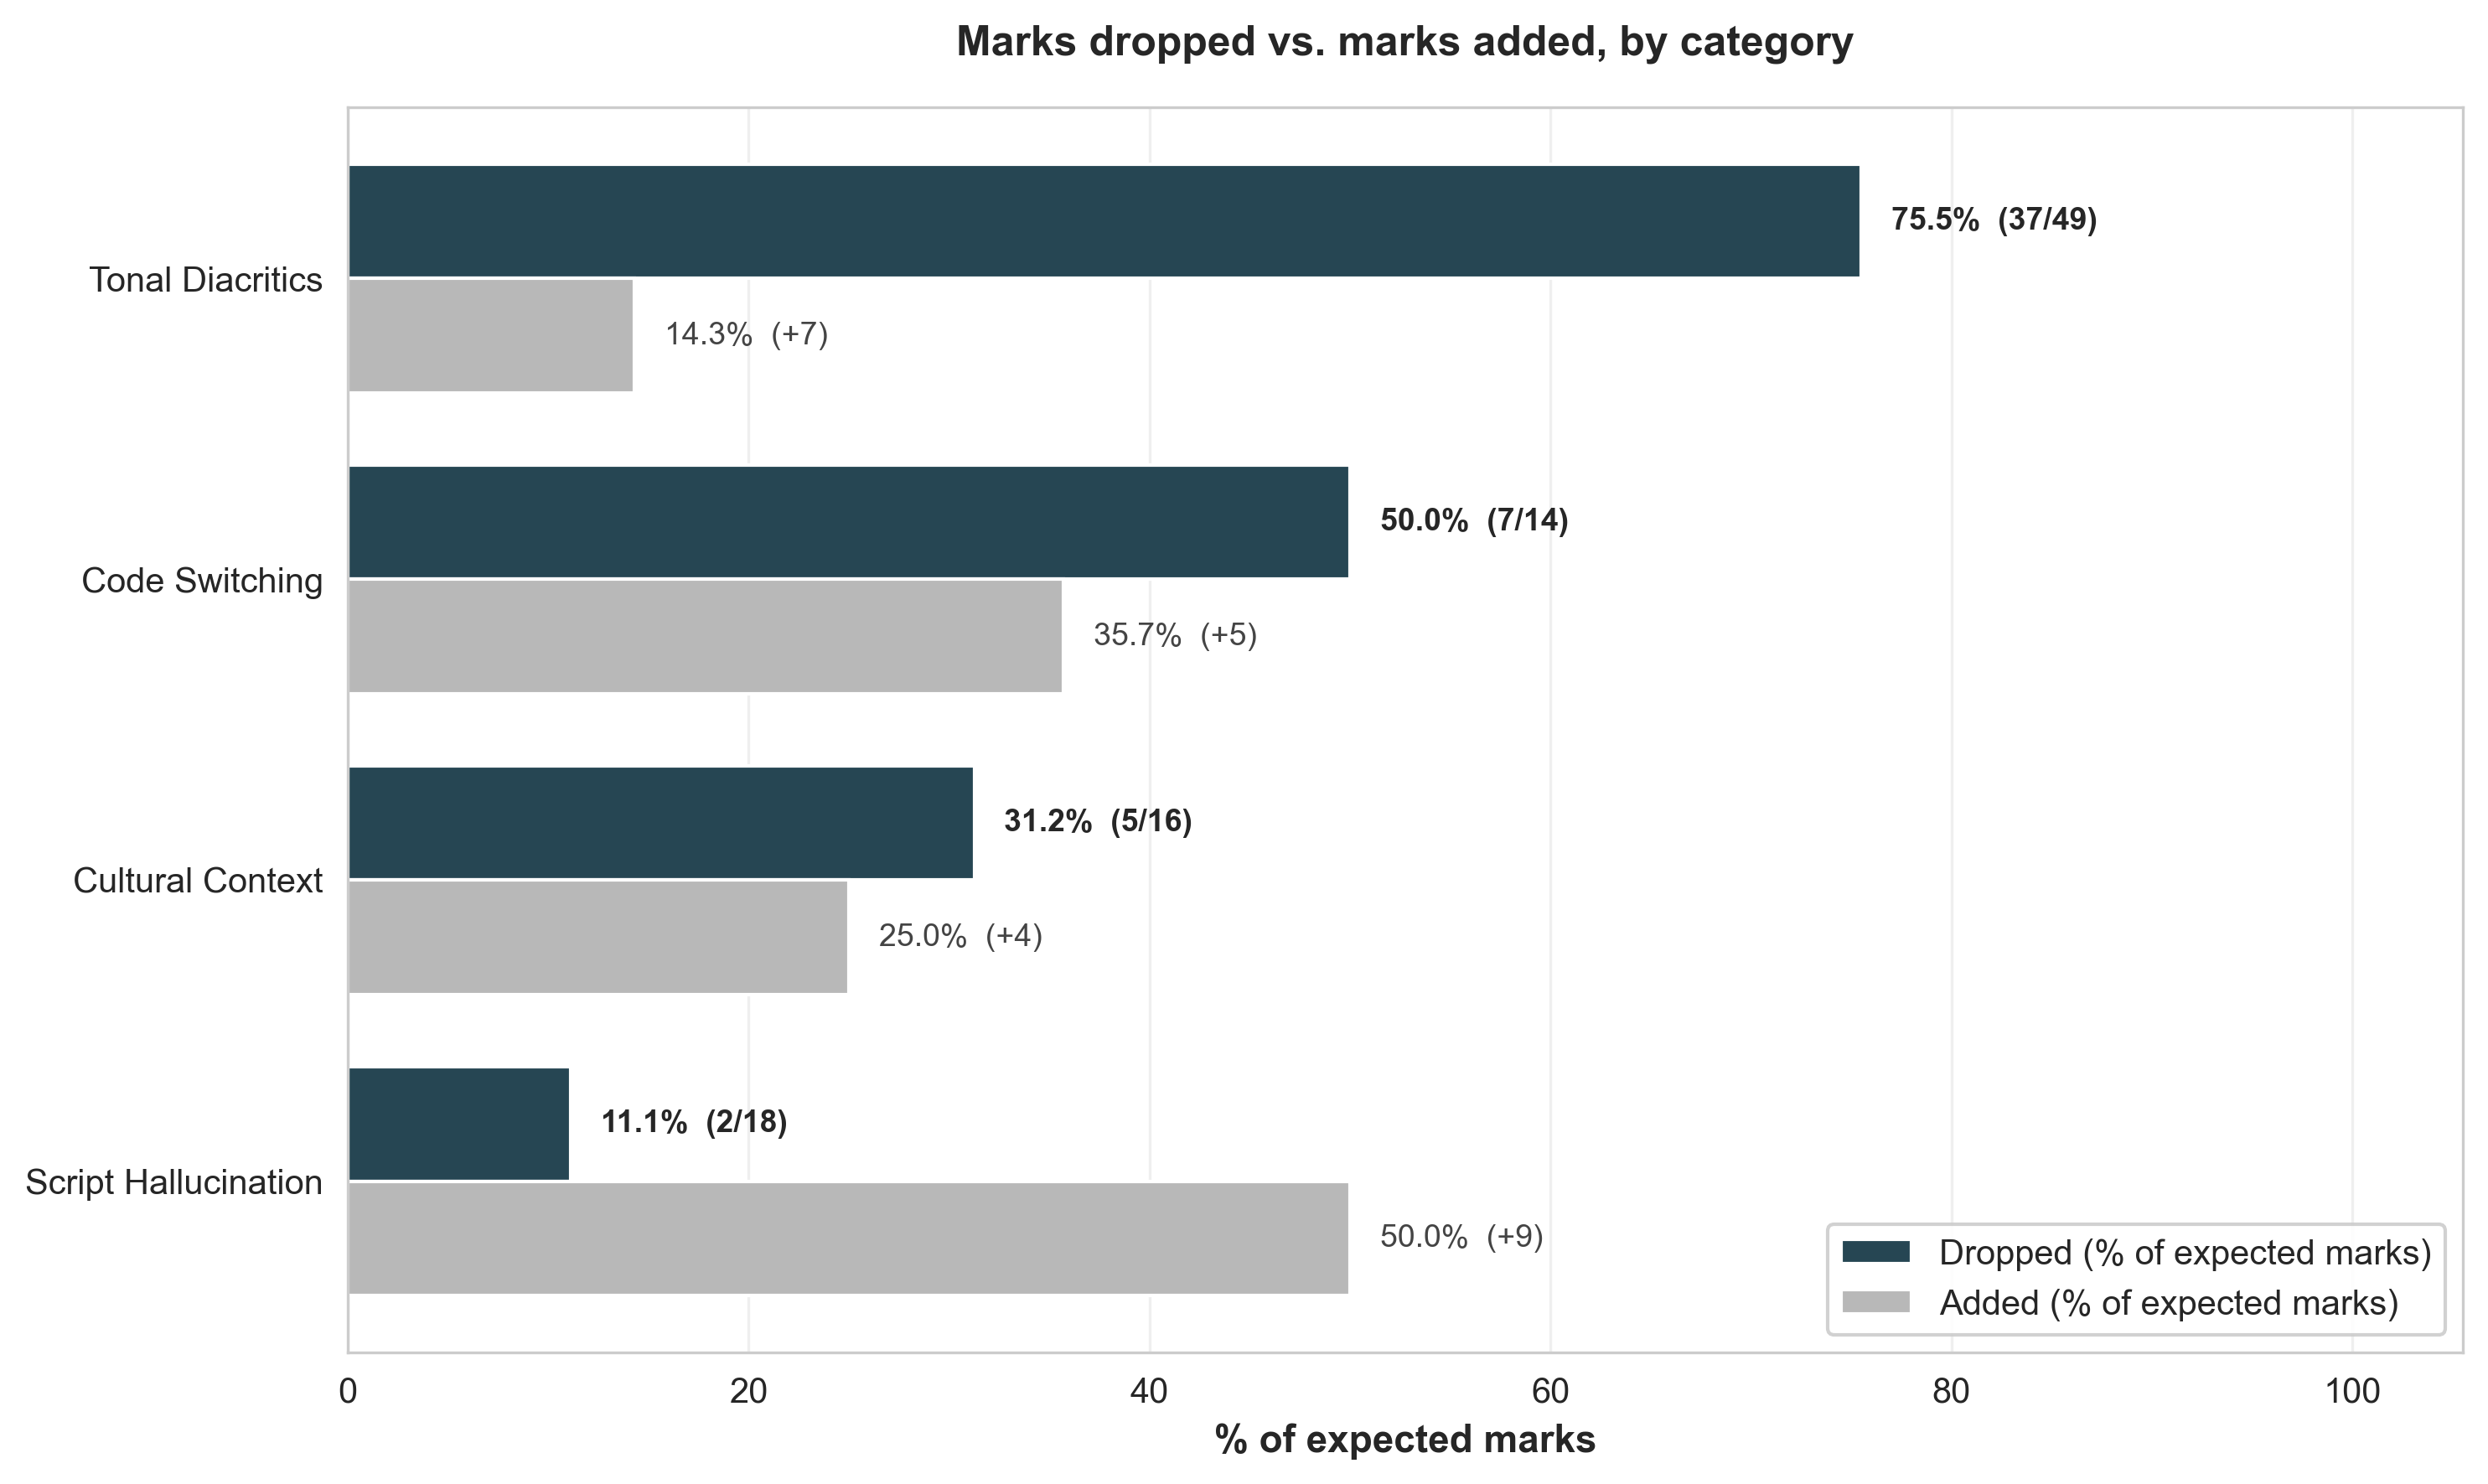 Paired bars for each category: drop rate (dark) and added rate (grey), with counts. Net loss alone would have hidden the large additions in the cross-lingual and language-boundary categories.
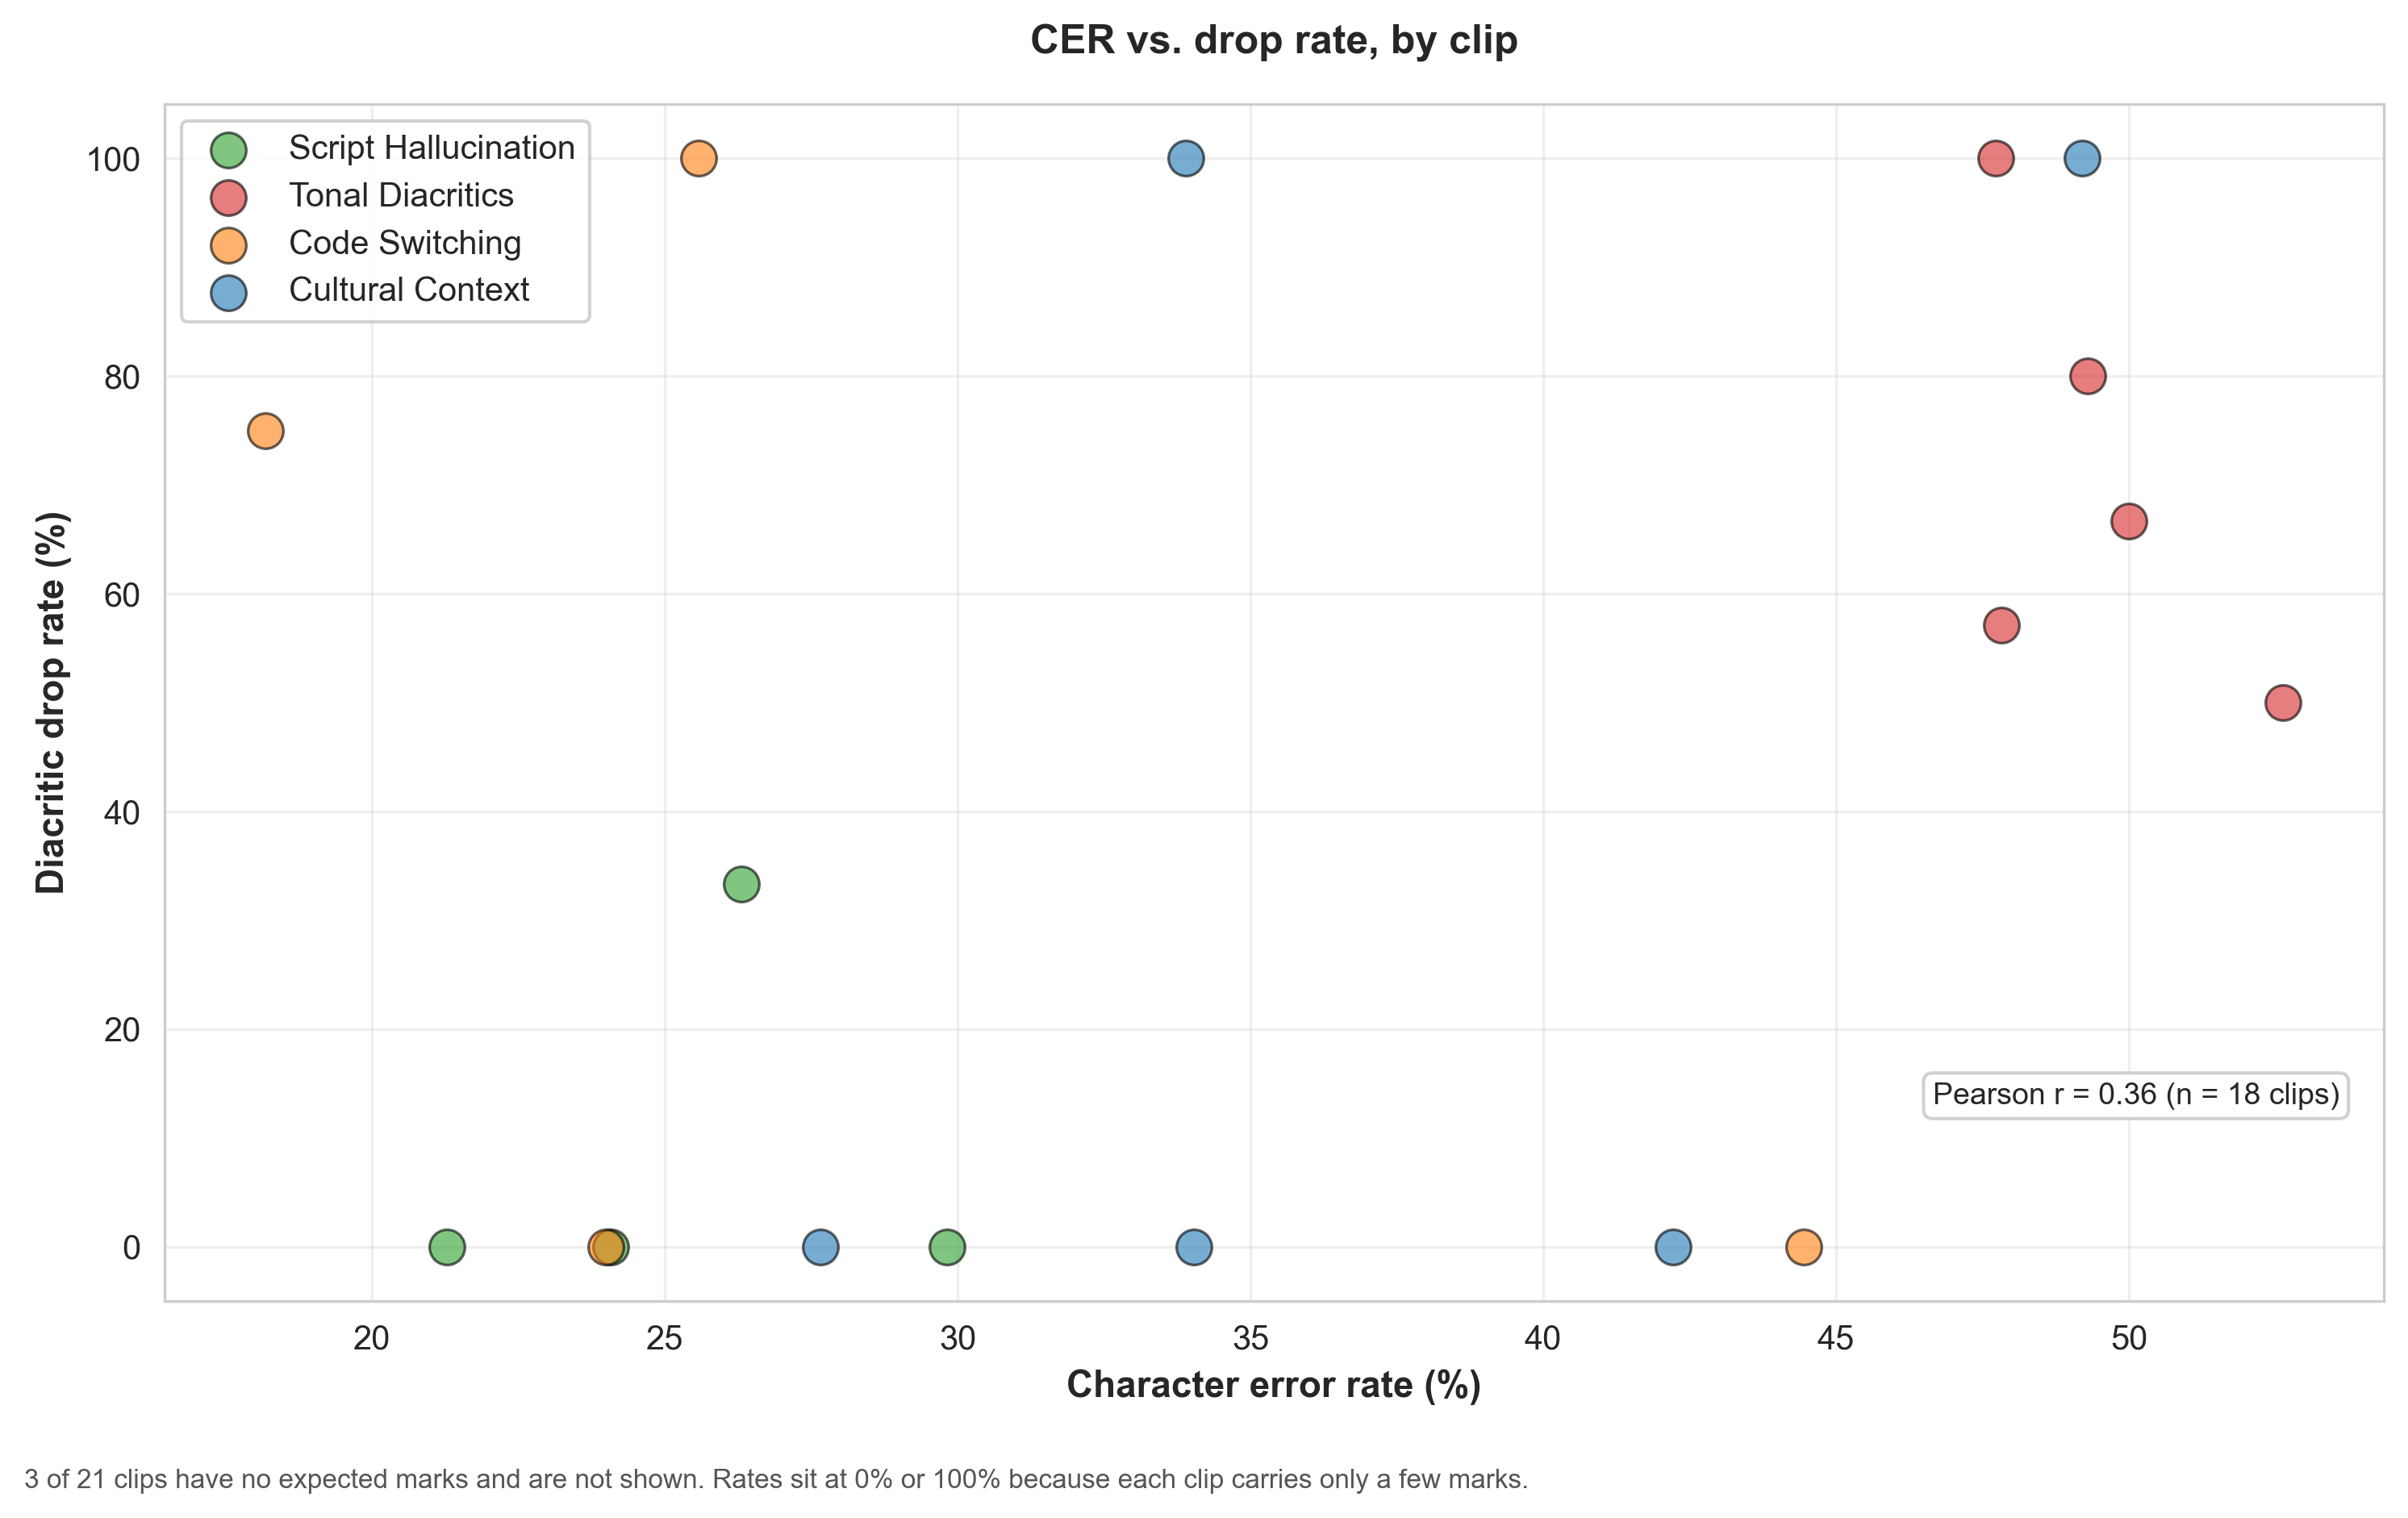 Per-clip CER against drop rate for the 18 clips with at least one expected mark (Pearson r = 0.36). Tonal clips (red) combine high CER (about 48% to 53%) with 50% to 100% mark loss, so with this few clips tone loss cannot be cleanly separated from general transcription errors.
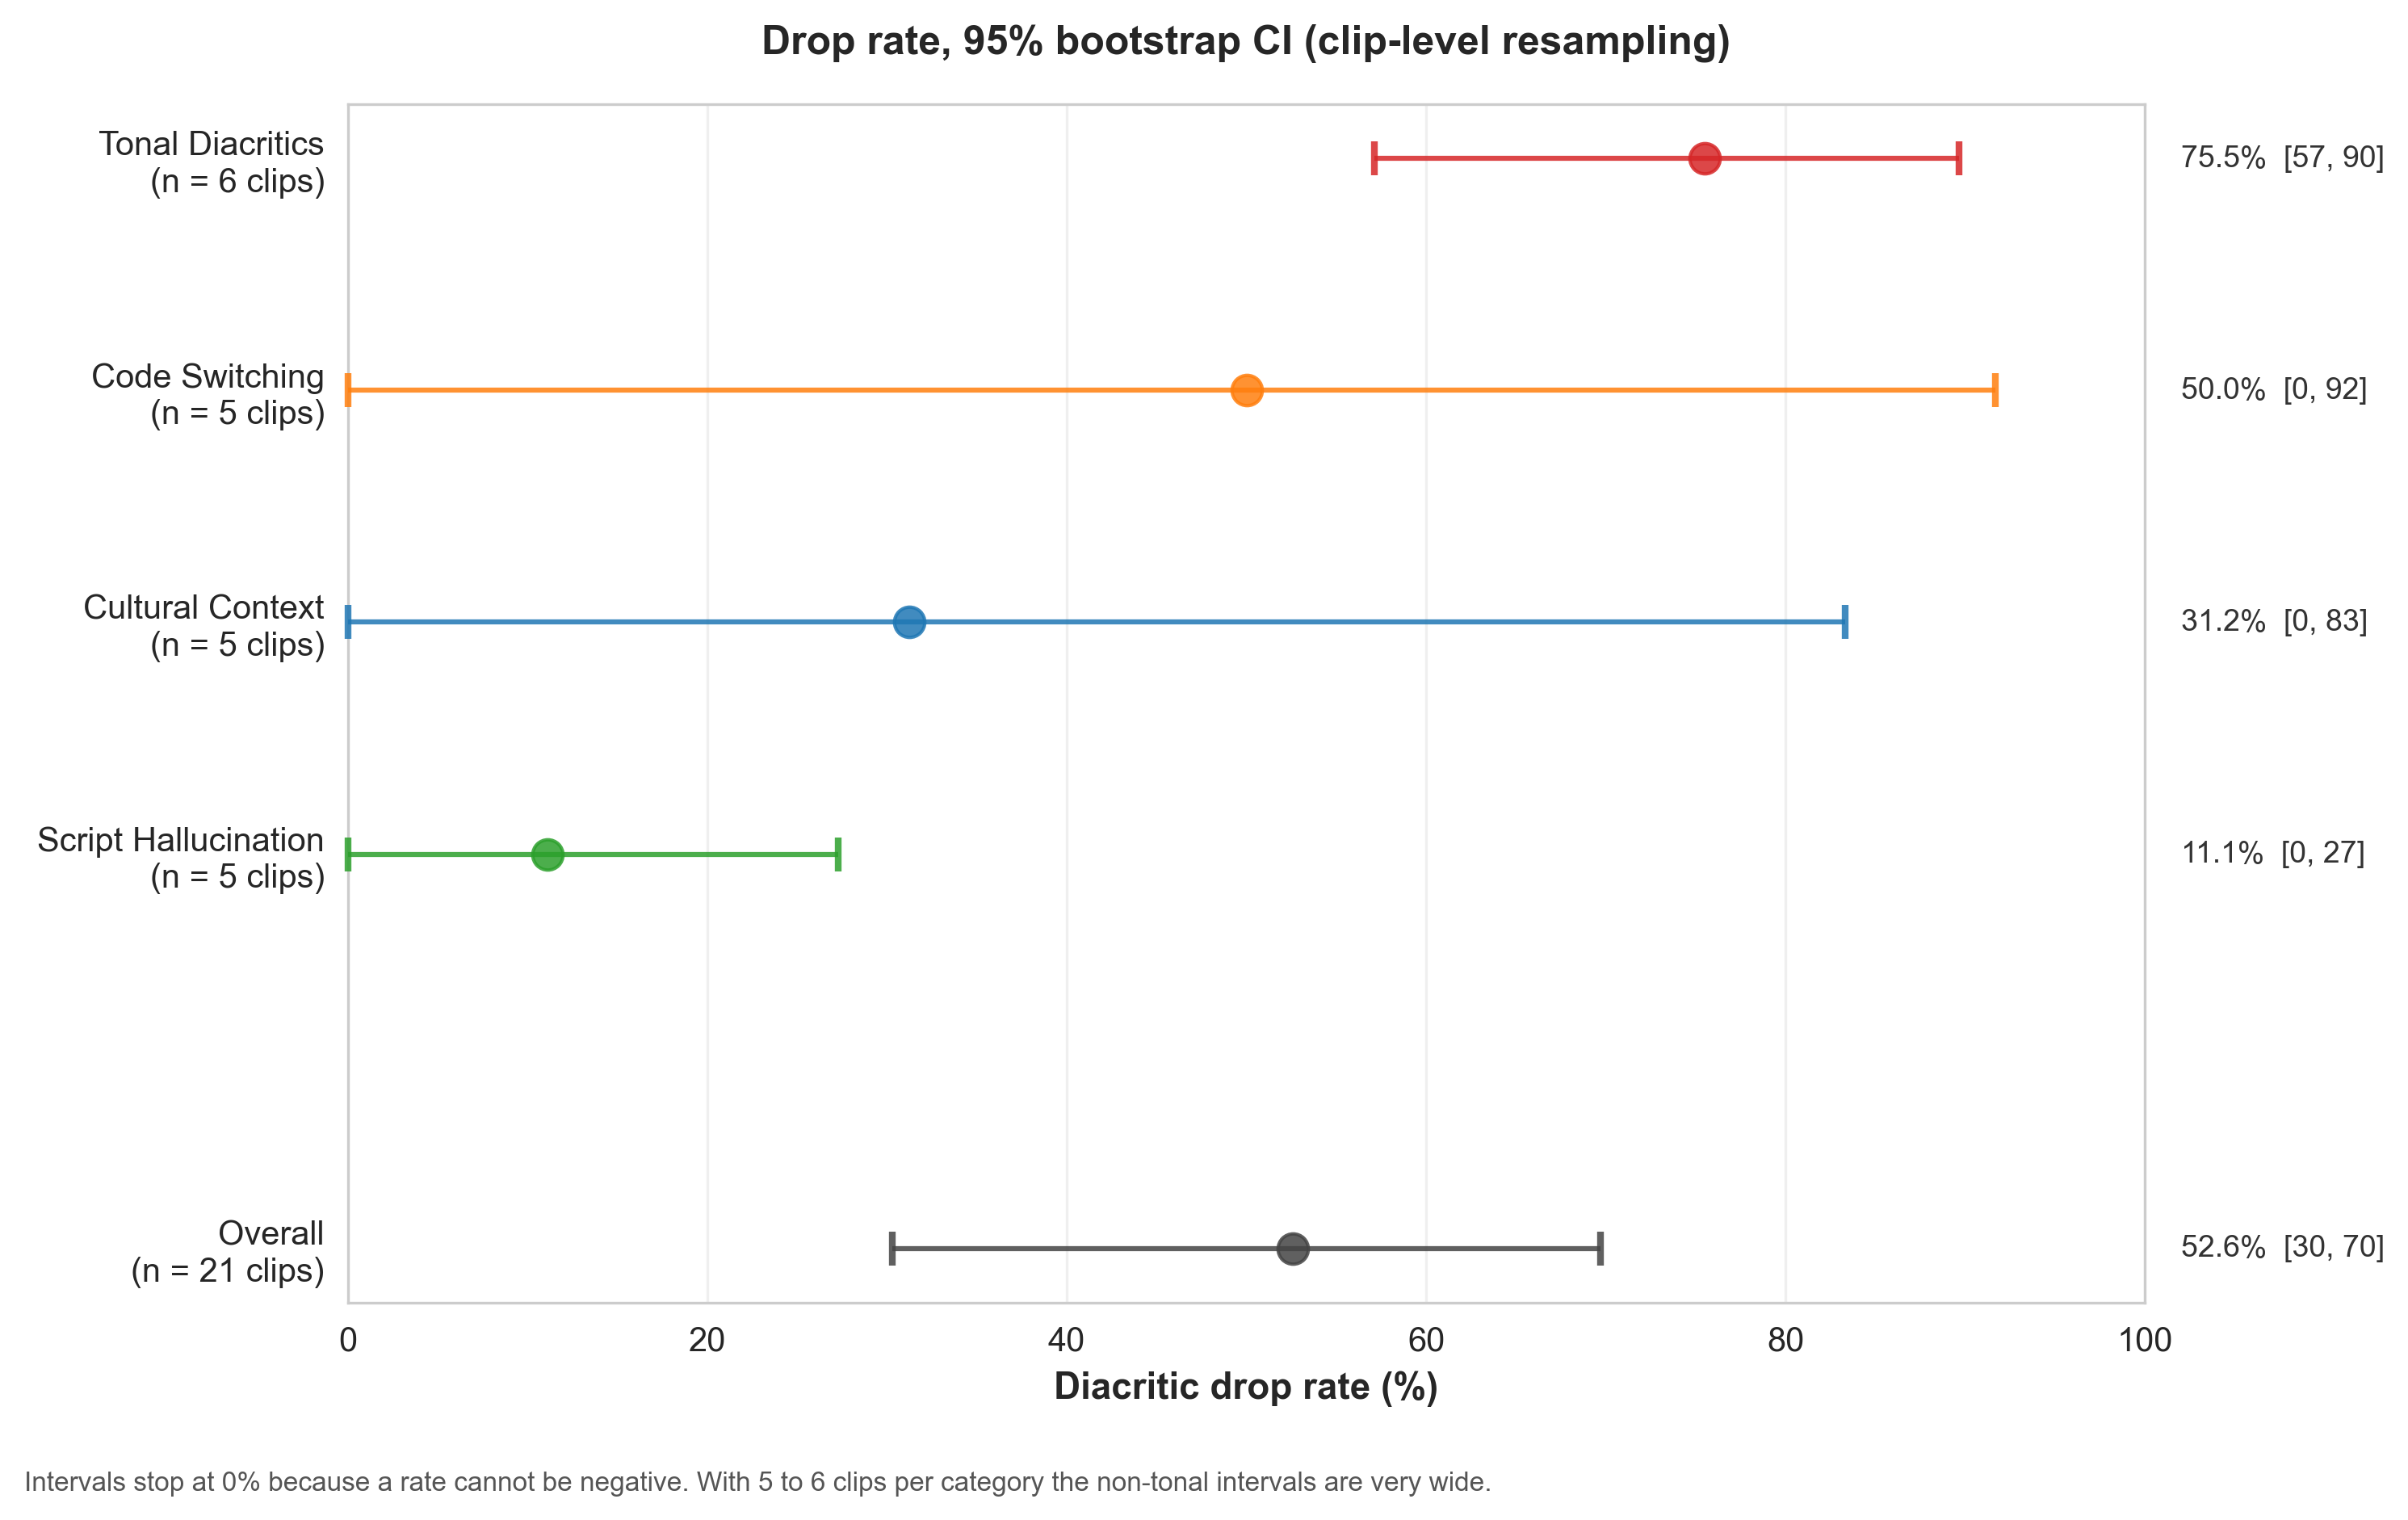 Drop rate with 95% clip-level bootstrap intervals. Intervals stop at 0% because a rate cannot be negative.
Example: Tonal Minimal Pairs
File 06 is the clearest demonstration:
Input (what I said):
"akwa, akwa, akwa. Akwà, akwà, akwà. Àkwà, àkwà, àkwà. Ákwá, ákwá, ákwá."

Model output:
"akua akua akua akua akwa akwa akwa akua akwa ọkua ọkua ọkua"

Expected marks: 15
Produced marks: 3
Drop rate: 12/15 = 80%
The four distinct tonal forms collapsed into the same few outputs, and the output carries no tone marks at all. From a linguistic perspective this is a serious loss, since the tone pattern is what separates these words.
The Monotone Test
File 09 is my favorite diagnostic. Setup:
- Spoke “O na-eri oji n’ututu” (He eats kolanut in the morning)
- Deliberately flat intonation, like a robot
- Zero tonal variation in the audio
If the model uses acoustic information to place diacritics, it should produce few or no tone marks on flat speech. Result:
Ground truth: "O na-eri oji n'ututu"  (0 marks)
Model output: "ọne rị ọjí nụ tútú"    (7 marks: 3 acute tone marks, 4 dot-below letters)
The model added tone marks I never spoke. That is consistent with orthographic bias over acoustic conditioning: placing marks from statistical patterns rather than listening. But it is one clip, and the four dot-below additions may simply be standard Igbo orthography, since I wrote the reference without dots. Treat this as a lead for a proper acoustic test, not as proof of the mechanism.
Statistical Analysis
Comparing categories
The question is whether the tonal category’s drop rate is higher than the others’. Overlap between two separate confidence intervals is not a test, so I used a paired bootstrap of the difference in drop rate (resampling clips within each category):
| Tonal minus | Difference in drop rate | 95% CI |
|---|---|---|
| Cross-lingual | 64.4 points | [40.5, 85.7] |
| Domain-Specific | 44.3 points | [-9.4, 80.6] |
| Language Boundary | 25.5 points | [-18.9, 78.6] |
Only the contrast with the cross-lingual category excludes zero. The tonal interval [57.1%, 89.7%] overlaps the language-boundary and domain intervals. So the data support “tonal clips drop many marks” but not “tonal clips drop more than every other category”. An earlier version of this post claimed the intervals did not overlap; that was incorrect.
Position-aware estimate
Counts cannot tell a correct mark from a mark on the wrong letter. I aligned reference and output on base letters and classified each mark. Overall: 33 correct, 7 wrong (right letter, different mark), 57 missing and 31 inserted. In the tonal clips: 4 correct, 7 wrong, 38 missing, 8 inserted. This is an estimate, since a mis-heard letter can make a mark look missing.
Robustness
The lower bound of the tonal interval (57.1%) means that if these six clips were a random sample of similar clips, drop rates far below that would be unlikely. Six clips from one speaker are not a random sample of Igbo speech, so the interval describes noise in this dataset, not a guarantee about the language.
Code
The full corrected analysis is in analysis-2.ipynb (offline, runs from data/metadata.csv in seconds, no GPU). analysis.ipynb is the original run that produced the model outputs. The core evaluation functions handle mark counting, character error rate (Levenshtein), bootstrap resampling, paired contrasts and the aligned-mark estimate.
All evaluation code is organized in the src/ directory. The evaluate.py module contains the metrics and bootstrap functions. The visualize.py module has plotting functions for all three figures. The utils.py module handles data loading and validation.
Run it
Clone the repository and reproduce the numbers:
git clone https://github.com/chizkidd/igbo-asr-tonal-evaluation.git
cd igbo-asr-tonal-evaluation
python3 -m pip install pandas numpy matplotlib seaborn
python3 src/evaluate.py data/metadata.csv
Or run analysis-2.ipynb in Google Colab (clone the repo in the first cell). Regenerating the model outputs (analysis.ipynb) needs a GPU. Running src/evaluate.py prints:
Pooled metrics (D and H computed per clip):
                      n_clips  expected  produced  dropped  added  net_loss  drop_rate  added_rate    DER  mean_cer
code_switching            5.0      14.0      12.0      7.0    5.0     0.143      0.500       0.357  0.857     0.257
cultural_context          5.0      16.0      15.0      5.0    4.0     0.062      0.312       0.250  0.562     0.374
script_hallucination      5.0      18.0      25.0      2.0    9.0    -0.389      0.111       0.500  0.611     0.285
tonal_diacritics          6.0      49.0      19.0     37.0    7.0     0.612      0.755       0.143  0.898     0.516
overall                  21.0      97.0      71.0     51.0   25.0     0.268      0.526       0.258  0.784     0.365

Bootstrap 95% CIs on drop rate (clip-level resampling, 10,000 draws):
  code_switching         0.500  [0.000, 0.917]
  cultural_context       0.312  [0.000, 0.833]
  script_hallucination   0.111  [0.000, 0.273]
  tonal_diacritics       0.755  [0.571, 0.897]
  overall                0.526  [0.303, 0.697]

Aligned mark classification:
                      correct  wrong  missing  inserted
code_switching              7      0        7         5
cultural_context            8      0        8         7
script_hallucination       14      0        4        11
tonal_diacritics            4      7       38         8
overall                    33      7       57        31
Model: omniASR-CTC-1B (975M params)
Data: 21 samples, 4 categories, 1 speaker
Metrics: Net loss, drop rate, added rate, DER, CER
Stats: Bootstrap with clip-level resampling, paired contrasts
Code: github.com/chizkidd/igbo-asr-tonal-evaluation
Scope and Limitations
This study demonstrates three things. First, a high rate of missing marks in omniASR on tonal Igbo clips (37 of 49 expected marks across six samples from one speaker). Second, failure to preserve tonal minimal pairs in this evaluation setup. Third, marks added on a monotone clip, which is consistent with orthographic bias but is a single clip.
This study does not claim six things. It doesn’t claim universal failure on all Igbo speech. It doesn’t claim that tone modeling is architecturally absent from the model. It doesn’t claim that Igbo is uniquely disadvantaged compared to all other low-resource languages. It doesn’t claim that the observed error rates generalize to all dialects or all speakers. It doesn’t claim that tonal clips lose more marks than every other category (only the cross-lingual contrast is clearly separated). And all references come from a single annotator, with no inter-annotator agreement measured.
What would strengthen these claims? A second annotator for the references. Multi-speaker evaluation with 10+ speakers across different dialects. Acoustic analysis with F0 contour extraction and pitch tracking validation. Comparative evaluation on other models like Whisper, MMS, USM, and Azure Speech. And controlled resynthesis experiments that isolate acoustic factors from lexical priors.
Current: Single speaker, 21 samples (proof-of-concept)
Next: 200 samples, 10+ speakers, 5 dialects
Then: Comparative evaluation (Whisper, MMS, Azure)
Finally: Fine-tuning intervention with tone-annotated data
Real Production Systems
Between this evaluation and a production-grade ASR fairness audit, there is a long list of things that change:
Data. Instead of 21 samples, production evaluations use thousands of hours across multiple speakers, dialects, ages, and recording conditions.
Speakers. Instead of single-speaker, you need balanced sampling across: dialects (Owerri, Onitsha, Enugu, Nsukka, Afikpo), gender, age ranges, native vs. L2 speakers.
Acoustic analysis. Instead of just comparing transcriptions, you need F0 (fundamental frequency) tracking to verify what’s actually in the audio. Praat or similar tools extract pitch contours frame-by-frame.
Comparative evaluation. Instead of one model, you audit multiple: Whisper (OpenAI), MMS (Meta), USM (Google), Azure Speech (Microsoft). This isolates whether the problem is specific to omniASR or universal.
Fine-tuning experiments. You collect tone-annotated Igbo data (50-100 hours), fine-tune the model, and measure pre/post accuracy. This tests whether the problem is architectural or just data scarcity.
Real-world deployment. You partner with Nigerian developers building voice assistants and measure downstream impact: do users trust ASR that strips tones? Does it affect adoption?
All of these are important, but if you understand this 21-sample evaluation, you understand the diagnostic methodology.
FAQ
Why only 21 samples? This is a proof-of-concept for blind spot discovery. Large datasets measure prevalence; small targeted datasets reveal failure modes. I prioritized depth (systematic coverage of error types) over breadth (statistical power).
Is the 75.5% drop rate generalizable? Not necessarily. This is the drop rate on my voice, my dialect, my recording setup, for these specific test cases. Multi-speaker evaluation would give population estimates.
Why not use Word Error Rate? WER measures whole-word accuracy. Many WER pipelines strip diacritics during normalization, in which case “akwa” vs “akwà” counts as correct even though they are different words. Even without normalization, a wrong tone mark and a completely wrong word both count as one word error, so you can’t tell them apart. Mark-specific metrics capture what WER hides.
Does the model “understand” Igbo? That’s philosophical. Mechanically: it learned statistical patterns from training data. Whether assigning probability distributions to tokens constitutes “understanding” is up to you.
Why did earlier versions show 61.2% and 75.5% for the tonal category? They are two different metrics. 61.2% is net loss ((E - P) / E, with 7 marks added offsetting 7 of the 37 dropped), and 75.5% is the drop rate (D / E). Neither is a bootstrap mean; the bootstrap gives an interval around the 75.5%.
What’s next? Collect a 200-sample multi-speaker dataset across 5 Igbo dialects. After that: comparative model evaluation (Whisper vs MMS vs omniASR) and fine-tuning experiments with tone-annotated data.
Why This Matters
There’s a tendency in ML to treat “supporting” a language as a checkbox. Add it to the model card, ship it. But Igbo has 45 million speakers. When ASR systems strip tone marks, they normalize a version of the language that doesn’t preserve meaning.
If every voice interface does this, what happens to how people write Igbo? Do they internalize that tone marks are optional because the AI doesn’t use them? I don’t know, but these are questions worth asking before claiming to “support” 1,600+ languages.
Resources
The dataset is available on Huggingface. The code is on GitHub. The model evaluated is facebook/omniASR-CTC-1B on HuggingFace. The dataset is licensed under CC-BY-4.0 and the code under MIT. Feel free to use it, cite it, and build on it.
Citation
If you found this evaluation helpful, please consider citing it:
@article{obasi2026tonalevaluation,
  title   = "Evaluating Tone Preservation in ASR: How Meta's omniASR Handles Igbo Diacritics",
  author  = "Obasi, Chizoba",
  journal = "chizkidd.github.io",
  year    = "2026",
  month   = "Mar",
  url     = "https://chizkidd.github.io/2026/03/01/tonal-fidelity-diagnostic-evaluation/"
}
For the dataset:
@misc{obasi2026igbodataset,
  title={Igbo Blind Spot Dataset for omniASR-CTC-1B: Systematic Evaluation of Tonal Diacritic Loss},
  author={Obasi, Chizoba},
  year={2026},
  publisher={HuggingFace},
  howpublished={\url{https://huggingface.co/datasets/Chiz/omniASR-igbo-blindspots}},
  note={Model evaluated: facebook/omniASR-CTC-1B (975M parameters)}
}